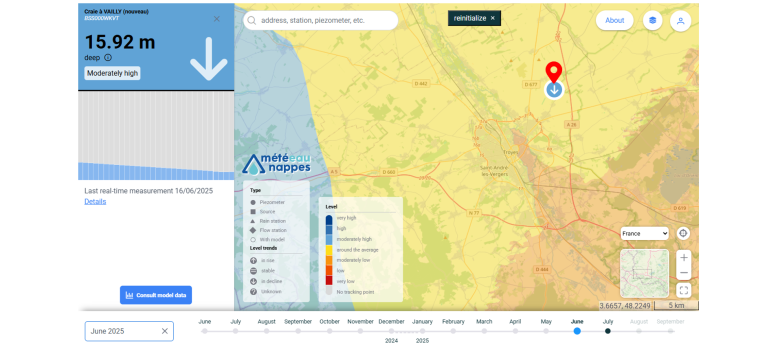
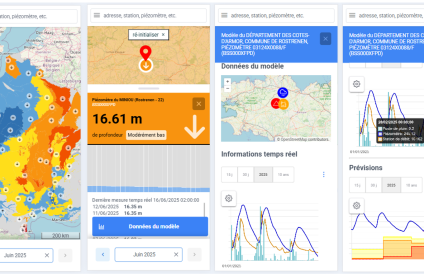
Current month national groundwater levels display
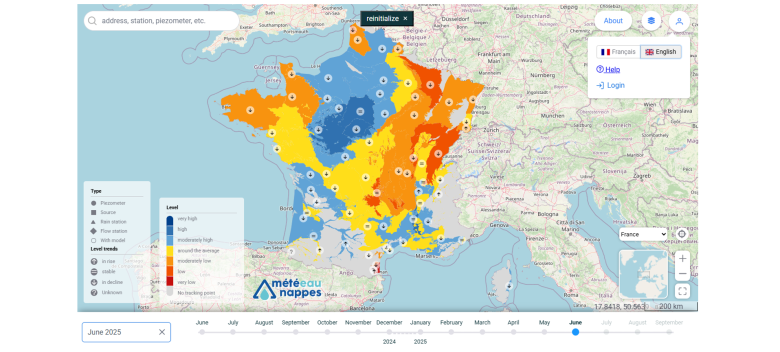
The first visible screen in the map application is the current month national groundwater status bulletin.
This national situation can also be displayed for past months (see timeline).
Hydrogeological sectors symbols and colours are respectively “Level trends” and “Aquifer levels” indicators.
Display of the groundwater level situation on a date chosen by the user
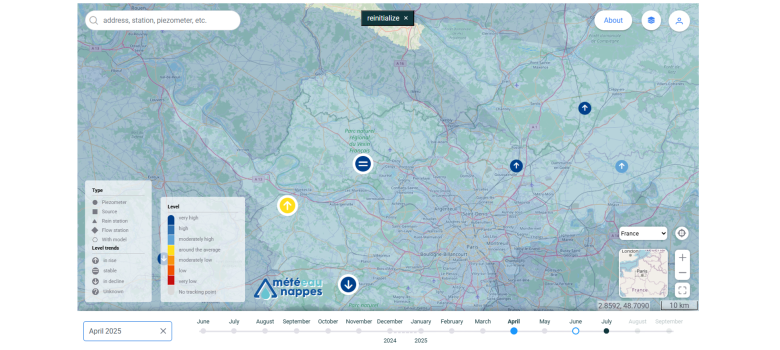
In the map part of the application, and depending on the user's choices, the state of the water tables can be displayed: either for the current date, or for a past date, or by choosing a future date (see timeline).
The groundwater level is based on the Standardised Piezometric Indicator calculated for the date chosen by the user.
Querying a monitoring well to display associated graphs
Clicking on one of the piezometers (user query of a monitoring well) displays a legend of its real-time state and the last measured groundwater level value.
For each point associated with a model, you can also consult its data and access a dynamic sheet updated at the current time (dynamic file with several associated graphs).
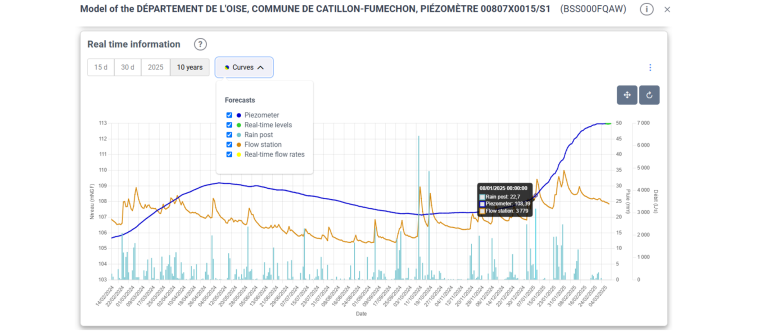
Example of a MeteEAU Nappes graph in the dynamic sheet of a monitoring well (situation on 07/03/2025)
© BRGM
Graphics display in real time
The graph shows various real-time measurements: river flow (historical in orange, real-time in yellow), rainfall (light blue), and groundwater levels (historical in dark blue, real-time in green).
After displaying this graph, the user can navigate on it (choose a time period, move, zoom) and download the associated image.
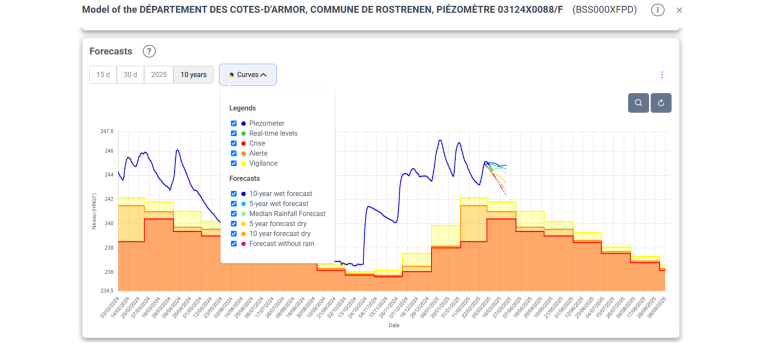
Detail of the water level forecasts on February 27th, 2025 in the dynamic sheet of a monitoring well
© BRGM
Forecast groundwater levels display
Forecasts can be consulted as well. The figure shows forecasts of groundwater levels under different climate scenarios.
Observed groundwater levels are superimposed on these forecasts and on the management piezometric thresholds (in low water periods).
Tooltips allow the user to display data for each day.
The key figures
-
1.00video
-
12.00hydrogeological bulletins per year
-
84.00models done
-
1600.00BRGM real-time piezometers
